
INSTRUCTIONS FOR NAVIGATING THE PFA PORTFOLIO ANALYZER
Welcome to the Precision Fiduciary Analytics PORTFOLIO ANALYZER. You can read the instructions on this screen or you can download the instructions on how to use the Analyzer, or both.
DOWNLOAD PDF: “Analyzer-Instructions”
LET’S GET STARTED: Entering portfolio assets and allocation percentages into the analyzer is somewhat non-intuitive, so be sure to follow the specific instructions listed below to achieve the most reliable outcome and make the entry tasks as easy as possible.
1. Select only risk assets for Analyzer screening mode (no cash or fixed income because 90% of Uncompensated Risk comes from risk assets).
2. Be sure to re-allocate percentages based on the risk asset portion of the portfolio, and not total value of all portfolio assets.
3. The Excel import function is available to Analyzer users or else make asset data entry a 2-step process that is accomplished manually.
4. The ticker symbols must be entered first. If you have just a few tickers, it will be faster to enter them one at a time in the designated space labeled: “Enter Your Stock or Fund Ticker Symbols”. Separate the tickers with a coma (and no spaces). After all the symbols are entered left click “Add Symbols”, or hit enter. If you have more than a few tickers to enter, see instructions below.
5. The analyzer will populate the portfolio palate with the names and symbols of the tickers you entered, arranged in the same sequence you entered them.
6. The analyzer has an ingrained fixed portfolio value of $1,000,000 for the screening therefore your percentage entries will be scaled to that fixed value. It is extremely important you accurately enter the percentages the first time as corrections, if needed, may cause totals to corrupt where a new run from the beginning will be required.
7. Carefully enter the percentage of each listed symbol. It is recommended that you round percentages to the nearest decimal point (e.g. 5.475% is entered as 5.5%). Also enter without using the % key; the system will automatically convert a number value to %. Thus, 5.5% is simply entered as 5.5. After entry move the pointer to the next symbol and enter the next % number.
8. After all of the allocation entries are made, hit enter and the system will populate the pallet with that security’s previous day’s closing information based on the percentage you entered times $1,000,000. Repeat this process until you come to the last symbol.
9. After entering the allocation percent for the last ticker symbol in your portfolio you will observe hitting the enter key does nothing. Instead, you must place the cursor in either the shares column or value column and left click your mouse. That will cause the system to complete the pallet values for the last ticker symbol, and then sum the allocation column to 100% and the value column to $1,000,000. THE TOTAL MUST EQUAL 100.0% or error message pops up.
10. Now, you are ready to direct the system to “Get My Portfolio Analytics” with a left mouse click on the green bar.
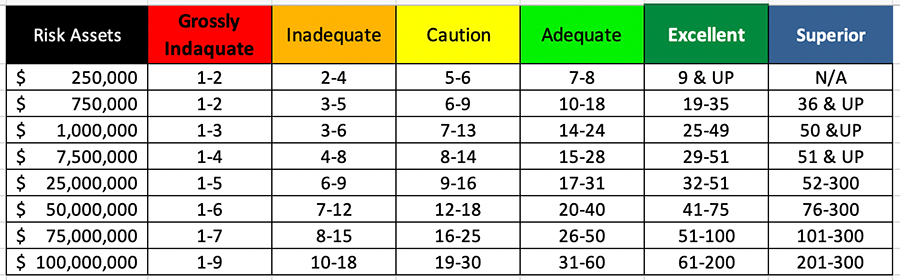
The Diversification Dashboard will have a fiduciary score for the portfolio as entered. Shown below is a matrix that has size of portfolio on one scale and the rating of diversification units on the other scale. The reason for this is smaller portfolios (e.g. $600,000 and less) need a smaller number of asset resources to have acceptable and reasonable scores, whereas portfolios with larger amounts of risk assets need higher scores. This is because larger portfolios have more opportunity to increase diversification.
Note the pull down options to the left and right sides of the sphere. Try them out and see what changes. Then navigate down to see more data including the correlation matrix at the bottom.
The following screens will be operable for your screening: DIVERSIFICATION DASHBOARD, POSITION PERFORMANCE, VECTORS, FRAME, ALLOCATIONS, BOXES, DETAILED P&L, ROLLING ALLOCATION CHART, HISTORICAL ALLOCATIONS, DIVERSIFICATION SOURCE CHART, RETURNS AND CORRELATION MATRIX.
You can run more than one portfolio. Just be sure you use the screen print function on your computer to print out the results when you have completed the analysis, as everything is erased when you change portfolios or log out. You can save the entry data for each analysis which makes it easy to go back, make some adjustments, and see how the dials and sphere changes.
The following screens or tables will not be working or you cannot navigate to them because they are part of the PFA PORTFOLIO OPTIMAZER Algorithms : POLICY TREE, POLICY TREE 2, POLICY GUIDELINES, PORTFOLIO EDIT, POSITION GRID, CONSTRAINT TAB, RETURN ESTIMATION GRID, GUEST EDIT, VIEW CONTROLS, COMPARE, COMPARISON PROFIT AND LOSS CHART, COMPARISON DIVERSIFICATION GAUGES, COMPARISON DIVERSIFICATION SOURCES, COMPARE RISK & RETURN, OBJECTIVES, RECOMMENDATION, EXCEL IMPORT, VERSIONS, RESEARCH, and SETTINGS.
We have designed the PFA PORTFOLIO OPTIMIZER system so it is very affordable for smaller firms and contains the same Artificial Intelligence abilities as the ENTERPRISE licensed system. For more information about PFA INTELLIGENT DIVERSIFICATION MEMBERS GROUP CONTACT US
The cost for an individual member is $95/month, or $275/quarter, or $975/year.
Multi-user and Enterprise License by request CONTACT US
There is a box you can check in the ANALYZER and to alert us that you want more information on becoming a member of the PFA INTELLIGENT DIVERSIFICATION GROUP or you CONTACT US now.
THIS IS A PRELIMINARY ANALYSIS OF UNCOMPENSATED RISK REMOVAL. ONLY THE QUANTITY OF ACTIVE INDEPENDENT SECURITIES FACTOR OF SEVERAL DIVERSIFICATION FACTORS HAS BEEN ANALYZED IN THIS SCREENING . ANALYSIS OF OTHER FACTORS USING THE ANALYZER-OPTIMIZER MIGHT SHOW DIFFERENCES, AND THOSE DIFFERENCES COULD BE SIGNIFICANT. RESULTS OF THIS SCREENING SHOULD NOT USED TO SELL OR PERSUADE POTENTIAL CLIENTS AND PRECISION FIDUCIARY ANALYTICS, INC. WILL NOT BE LIABLE FOR ANY DAMAGES THAT MAY BE CLAIMED AT A LATER DATE BY SUCH INDIVIDUALS OR ENTITIES.